

For about twenty years, dashboards promised us visibility. What companies actually needed was judgment.
A dashboard can tell you sales dropped 12% in one region. It can flag a jump in customer complaints, a dip in engagement, or a pile of unsold inventory. What it can’t do is tell you why any of that matters, weigh the possible explanations, forecast what comes next, or suggest what to do about it.
That’s why BI so often turns into a bottleneck instead of a decision engine. A new wave of multi-agent AI systems is trying to fix this. They aren’t after prettier charts. They want to turn analytics into a continuous loop that investigates and decides on its own.
And this isn’t just theory. NielsenIQ director Viswajith Karapoondi Nott has built a proof-of-concept multi-agent system meant to make complex business information easier to get at. Specialized agents interpret the user’s question, pick the relevant metrics, write valid database queries, and present the results in plain language. It’s still a research prototype, not a commercial product, but it shows where enterprise analytics is headed.
The hidden cost of self-service analytics
Dashboards don’t fail because they display data badly. They fail because they leave the hardest parts of analytics to people: interpreting, diagnosing, prioritizing, and acting.
Here’s how a typical workflow still goes:
- A business user spots an odd number on a dashboard.
- They ask an analyst to look into it.
- The analyst pulls data from several systems, tests a few hypotheses, and builds a view.
- Leadership meets to talk through the findings.
- Someone turns that discussion into a decision.
- Another team carries it out.
- Weeks later, someone checks whether it worked.
Every step adds delay, and every delay shrinks the value of the insight.
For businesses that face consumers, this hurts even more. Preferences, competitor pricing, media exposure, stock levels, and retail conditions shift constantly. By the time a dashboard shows a trend, the window to respond may already be closing.
Think of a dashboard as a rearview mirror. An autonomous insights engine is more like a co-pilot. It watches the road, notices when things drift, proposes a route, and explains the trade-offs.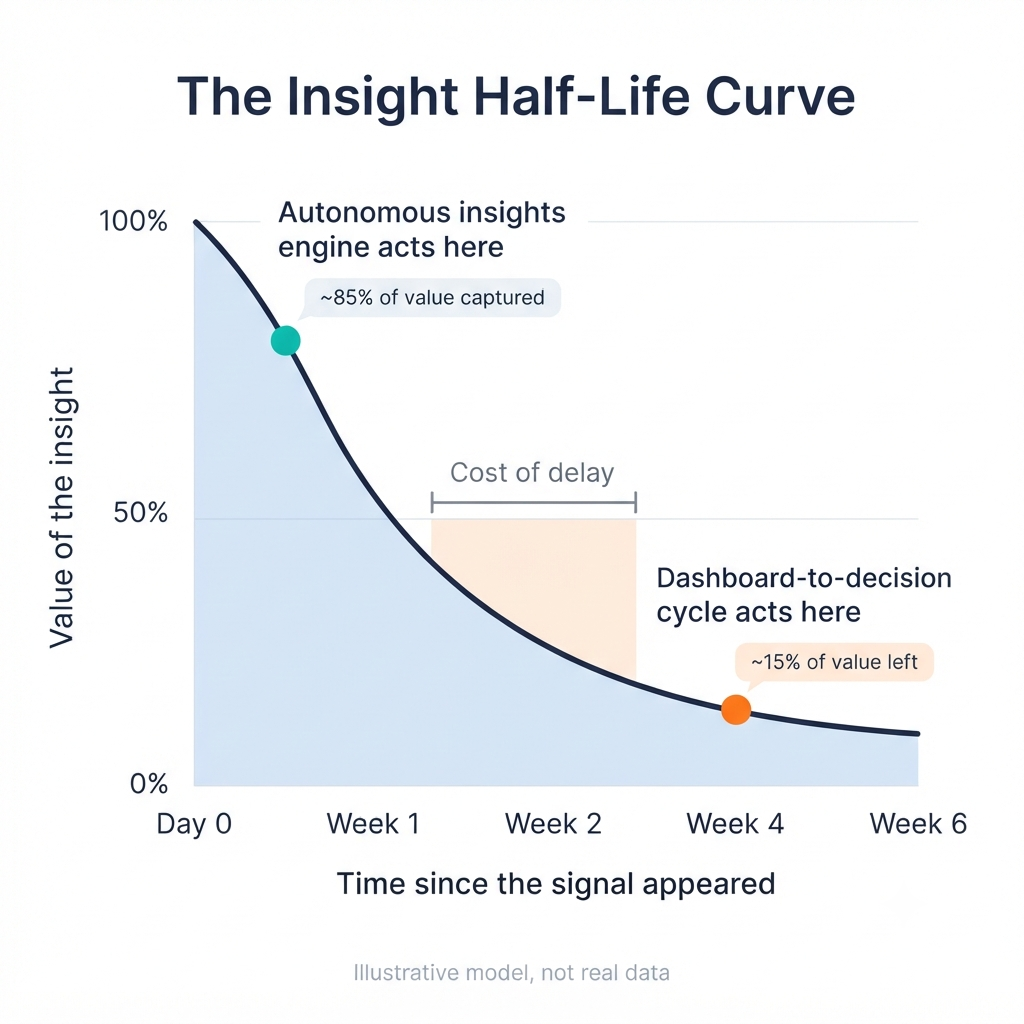
What is an autonomous insights engine?
An autonomous insights engine is an AI system that continuously takes in company and market data, investigates anomalies and opportunities, builds evidence-based explanations, and recommends (or kicks off) the next best action.
It doesn’t stop at “What happened?”
It works through a longer chain of questions:
- What happened?
- Why did it happen?
- Which explanation does the evidence support best?
- What’s the likely business impact?
- What should we do next?
- What happens if we do nothing?
- Did the fix work?
The difference goes beyond automation. It’s a move from reactive reporting to proactive agentic reasoning.
| Dimension | Traditional BI dashboard | Autonomous insights engine |
|---|---|---|
| Primary output | Visualizations and KPIs | Diagnoses, recommendations, and actions |
| Mode of operation | Human-initiated, periodic review | Continuous monitoring and investigation |
| Question handled | “What happened?” | “What happened, why, what should we do, and what happens if we do nothing?” |
| Data relationship | Static views of curated datasets | Active orchestration across data, models, and workflows |
| Human role | Interpret charts and decide | Review evidence, set guardrails, approve high-impact actions |
| Value creation | Visibility | Decision velocity and market responsiveness |
The multi-agent workforce
The big shift here isn’t that AI can answer questions in plain English. It’s that AI can be organized like a workforce of specialists, each owning a distinct piece of the analysis.
A single general-purpose chatbot might give you a plausible answer. A multi-agent system can split up the work, challenge assumptions, check each other’s outputs, and put together a recommendation you can defend.
The orchestration layer
At the center sits an orchestration layer. It takes in a business question, an alert, or a scheduled goal, breaks it into analytical tasks, hands those to the right specialists, and pulls their findings together into one coherent result.
Say a business leader asks:
“Why did premium snack sales decline in the Northeast last month, and what should we do about it?”
The orchestrator doesn’t treat that as one question. It breaks it into steps: confirm the decline, narrow down the affected markets and products, test the likely causes, check consumer sentiment, forecast the outcomes, and recommend actions.
Core analytical agents
| Agent | Job | Example output |
|---|---|---|
| Query interpreter | Translates a business question into an analytical task | “Identify the drivers of a 12% sales decline in the Northeast over 14 days.” |
| Metric selector | Chooses relevant KPIs, dimensions, and baselines | Selects sell-through, price elasticity, distribution, promotion exposure, and category growth |
| Data/query agent | Constructs and executes valid database queries | Retrieves comparable-store sales, inventory, media spend, and competitor pricing |
| Anomaly detection agent | Finds statistically meaningful deviations | Flags an unusual decline concentrated in specific retailers or demographics |
| Consumer-sentiment agent | Parses reviews, social listening, surveys, and support data | Detects rising frustration around packaging or delivery experience |
| Forecasting agent | Projects likely outcomes under scenarios | Estimates revenue impact if the issue persists for 30, 60, or 90 days |
| Strategy/recommendation agent | Converts findings into actions | Recommends a targeted promotion, supply reallocation, or messaging change |
| Governance agent | Checks assumptions, data quality, permissions, and confidence | Flags low-confidence conclusions or restricted data access |
Nott’s prototype follows a similar design: separate agents handle query interpretation, metric selection, database queries, and presenting results. The point is to cut down the technical effort needed to get answers, so business users don’t have to become data engineers.
From anomaly to action
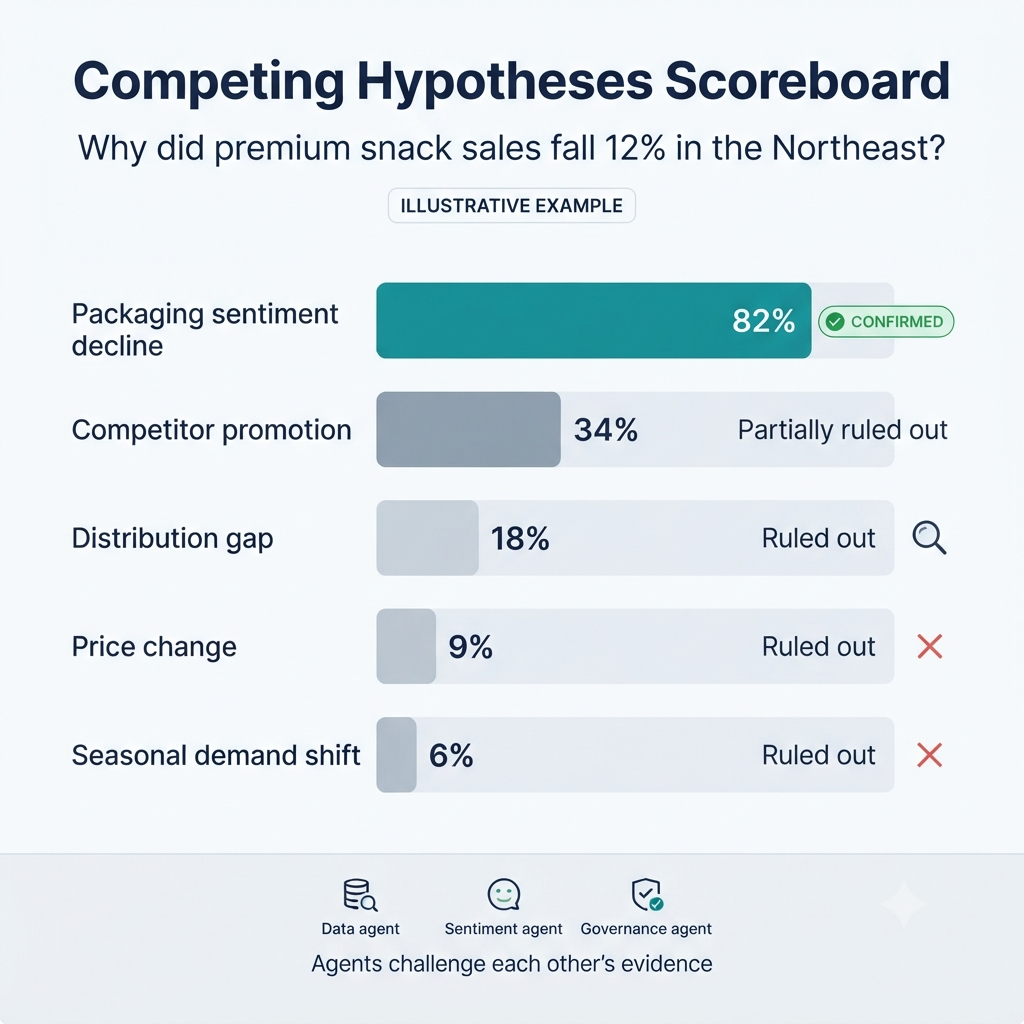
The real power of a multi-agent system shows up when it runs as a loop.
Picture a consumer-products brand that suddenly sees sales fall in one region.
- Detect: The anomaly-detection agent spots the unexpected drop and checks whether it’s statistically meaningful.
- Investigate: The data, sentiment, and market-context agents test competing explanations: promotion changes, competitor moves, distribution gaps, pricing, product availability, or shifting consumer tastes.
- Quantify: The forecasting agent estimates the likely revenue impact and is upfront about the uncertainty.
- Recommend: The strategy agent lays out options along with expected outcomes, costs, risks, and trade-offs.
- Decide or act: A human signs off on any high-impact move, while an authorized agent can run low-risk workflows.
- Learn: The system records whether the intervention worked and uses that to sharpen future recommendations.
Instead of waiting for an analyst to dig into the decline, the organization gets an evidence-backed diagnosis and a set of options it can act on.
That’s the gap between knowing something changed and knowing what to do about it.
Why “autonomous” doesn’t mean unsupervised
People often hear “autonomous” and think “unsupervised.” In a company, that would be reckless.
The goal isn’t to take humans out of decisions. It’s to take them out of the repetitive grind of finding, cleaning, correlating, and explaining data, so they can spend their time on judgment, strategy, and accountability.
A responsible autonomous insights engine needs a few things:
- Human-in-the-loop controls: Agents recommend, and people approve the decisions that matter.
- Tiered autonomy: Agents can monitor, investigate, and draft insights on their own, but execution stays governed and reversible.
- Explainability: Every recommendation should show its data sources, assumptions, metrics, the alternatives considered, and a confidence level.
- Permissions and auditability: Agents need role-based access, full audit trails, and clear escalation paths.
- Evaluation: Measure decision quality, time-to-insight, how often actions get adopted, and business outcomes, not just model accuracy.
Tomorrow’s analytics teams won’t disappear. Analysts will move up from producing reports to designing strategy, supervising models, and owning decisions.
Market research becomes a live sensor network
This shift matters a lot for market research.
Traditional research usually answers questions after the fact. A brand runs an ad, collects results, commissions a study, and finds out what worked when it’s too late to change anything.
Agentic systems can continuously blend sales, media, retail, social, review, survey, and behavioral signals. Rather than a quarterly consumer-insights deck, you get a live picture of demand, sentiment, competitor movement, and campaign performance.
That changes what market research is. It stops being a periodic measurement exercise and becomes a real-time strategic sensor network.
Nott’s wider work reflects this blend of analytics, consumer neuroscience, and predictive modeling. Besides the multi-agent prototype, he has explored natural-language search for advertising images, and systems that combine brain-wave records with video and audio to study attention and engagement.
What enterprises should build first
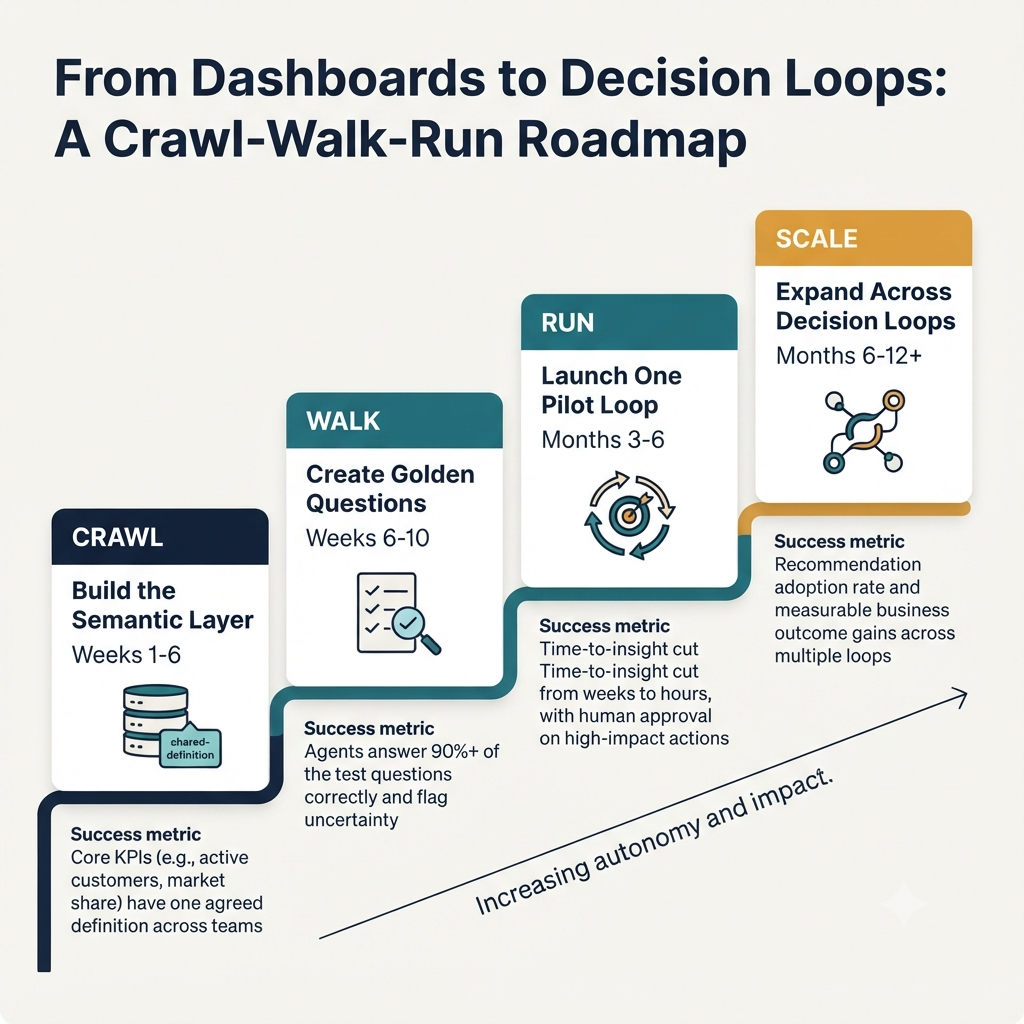
Nobody needs to rip out their whole analytics stack overnight. The practical move is to automate one high-value decision loop first.
Good places to start:
- Promotional performance and trade-spend optimization
- Customer churn and retention
- Inventory and supply-chain risk
- Campaign effectiveness and media mix
- Pricing anomalies and competitor response
- Product-quality or customer-experience issues
- New-product launch performance
Before picking tools, define the agent roles. A clear role map keeps agents from duplicating work or reaching conflicting conclusions.
It’s also worth investing in a trusted semantic layer. If “active customers,” “conversion,” “market share,” or “brand health” mean different things in different departments, agents can’t reason reliably about the business.
Finally, build evaluation datasets and a set of “golden questions.” Check whether your agents choose the right metrics, query the right data, reach conclusions you can defend, and flag uncertainty when they should.
The new analytics operating model
The companies that benefit most won’t just bolt AI onto BI. They’ll rebuild analytics around outcomes, accountability, and how fast they can decide.
| Legacy role | Emerging role |
|---|---|
| Dashboard builder | Decision-loop architect |
| Business analyst | Insight validator and strategy partner |
| Data engineer | Agent and data-product enabler |
| Data scientist | Model evaluator and forecasting owner |
| Business leader | Objective setter and decision owner |
| Governance team | Autonomy policy and audit owner |
In this model, the dashboard doesn’t vanish. It becomes an evidence surface, a place where people can inspect what the agents found, question their reasoning, and oversee high-stakes decisions.
It just isn’t the destination anymore.
The end of the dashboard era
The future of business intelligence isn’t a nicer-looking chart.
It’s a workforce of specialized agents that turns data into a strategy that keeps improving: spotting signals, investigating causes, forecasting consequences, recommending actions, and learning from the results.
Companies will stop asking, “What does the dashboard say?”
They’ll start asking, “What did the insights engine investigate, recommend, and learn today?”
That’s the real death of the dashboard. Visualization doesn’t go away, but it stops being the final word in decision-making.